Workshop Lizmap#
Pre-requirements#
This workshop is designed for QGIS users.
- QGIS 3.40
- Latest Lizmap plugin on QGIS Desktop
- Lizmap Web Client 3.9.X
QGIS UC 2025#
Presentations talking about QGIS Server and Lizmap during this QGIS UC from 3Liz :
- Today, one hour ago
- Lizmap, past, present and future
- Wait for the replay
- Room Statisten, tomorrow morning, 12:00PM
- Dynamic layers : a single project to rule them all
- Bonus, use the output of Dynamic Layers plugin in Lizmap
Links#
- Demo https://demo.lizmap.com
- Lizmap cloud out-of-the-box https://www.lizmap.com
- PDF/HTML presentations and videos https://docs.3liz.org/talks/#lizmap
- Discourse channel https://discourse.osgeo.org
- Twitter accounts :
- https://twitter.com/LizmapForQgis dedicated to Lizmap
- https://twitter.com/3LIZ_news about 3Liz
- Source code
- Lizmap Web Client https://github.com/3liz/lizmap-web-client/
- Lizmap QGIS Desktop side https://github.com/3liz/lizmap-plugin/
- Lizmap QGIS Server side https://github.com/3liz/qgis-lizmap-server-plugin
- 3Liz https://github.com/3liz/ for QGIS Server plugins, Lizmap modules
- National user group
- Stafe of translations
Documentation#
Setting up the training#
- Install the Lizmap plugin on your QGIS
- Open it, either from the toolbar, or from the Web menu
- Click Add your first server or the + icon at the bottom
- Fill the wizard :
- URL : https://workshop.lizmap.com/norrkoping
- Login :
user_X, replaceXby your number in login and password - Password :
user@X
Warning
QGIS might ask you to set up a master password. This password belongs to you and is not linked to Lizmap. It's to lock your internal QGIS password manager.
Question
Is-it 👍 or something else ?
Info
This workshop was designed for 3 hours, so some steps in the QGIS downloaded project are already done.
First quick map#
- Open the project
- Set the extent on the map canvas to have all islands visible
- In the Project Properties :
- Project menu ➡ Properties
- Relations tab, add all relations automatically with Discover Relations and select them all with ctrl
- QGIS Server tab,
- Enable Service capabilities
- set a title such as
NAME Trainingand an abstract about the purpose of the project. You can fill the author, organization, phone, email as well if you want. - You are free to use the text you want for these fields.
- You can set keywords if needed. You will be to search your project with keywords in the landing page.
- set a title such as
- WMS capabilities
- use the current canvas extent for the advertised extent
- WFS capabilities
- Use the checkbox published for all layers
- Enable Service capabilities
- Press Ok
- Open the Lizmap plugin
- In the
Layerstab, make some layers visible by default - At the bottom, let's choose the remote "directory" where to send this project
- Press "Apply" or "OK" to start the Lizmap file generation
- Let's fix the "blocking" error
- Visit your Lizmap instance in the web browser
Tip
Bonus if you have a small PNG picture called name_of_project.qgs.png to replace the default project thumbnail.
It works as well with jpg, jpeg files.
Quick overview of the Lizmap web interface#
- The map
- Lizmap folders
- Administration panel
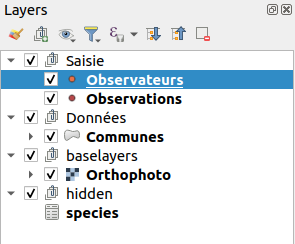
Legend#
- Add some groups in the legend
EditingwithpersonsandobservationsDatawithmunicipalities- With the help of the plugin, in the fourth tab
- You can add OSM base layer and the IGN Orthophoto.
hiddenwithspecies
- Reorder layers to put them inside these groups according to the screenshot below
- Rename layers with a more human-readable
Tip
The baselayers group, you can add layers you want. This group will display layers inside as a drop-down menu.
Success
Lizmap is using QGIS Server in the background, the legend is, therefore, the same as in QGIS Desktop.
Some settings in the QGIS project or in the Lizmap plugin can have effects in the web interface.
- Make a quick symbology on a point layer :
- on
persons, change the default symbol using a single symbol. - On
observations, we can try Categorized using the fieldfk_id_specie. You can use the QML already made (Vector layer properties ➡ Styles at the bottom ➡ Load styles).
- on
- Add labels on the municipalities layer and add a scale based visibility for these labels (1:300 000)
namefield for the source- Rendering tab, scale based visibility minimum set to
1:300 000
- Go in the Lizmap plugin, Layers tab :
- Enable the municipalities layer by default
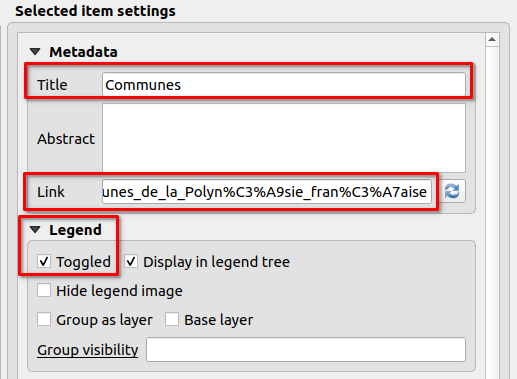
- Add some links on two layers:
- PDF for the persons layer :
media/metadata.pdf, a PDF link, stored in the foldermediaon the server (you can see it in the WebDAV client) - HTML for the municipalities :
https://en.wikipedia.org/wiki/French_Polynesia
- PDF for the persons layer :
- Go in Baselayers tag and add the OpenStreetMap Mapnik background.
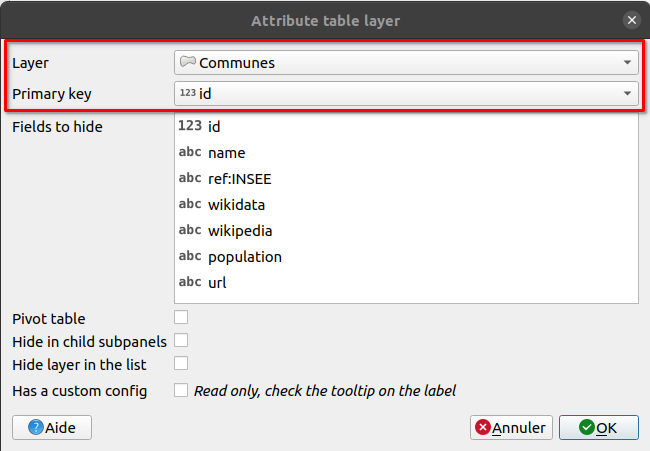
Attribute table#
- From the plugin, enable the attribute table for the municipalities layer.
- In the Attribute table tab, add a new layer
Tip
We can improve our attribute table by adding some alias on the fields :
- Properties on the vector layer ➡ Form attributes ➡ Alias for all fields
Tip
Two new tools appeared in Lizmap Web Client : Attribute table as expected, but also Selection. Let's have a look.
Let's identify the feature by clicking#
- In the Lizmap plugin, layers tab, enable some popups on the layer municipalities with
automaticmode and check the results by clicking on a municipality.
Tip
The automatic popup will use alias if available on the layer.
- Let's get back in the Lizmap plugin Let's switch to a popup with QGIS HTML Maptip mode on the same layer
- Click on the Generate an HTML table
- In the
communesvector layer properties, rendering tab, then HTML Maptip, check the generated HTML. - Tip : QGIS ➡ View ➡ Show Map Tips to display maptip straight in QGIS Desktop. You need to select the maptip tool in the toolbar as well.
These QGIS popups are powerful with the use of QGIS expressions. 🚀
With some expressions inside#
You can use expressions :
- to display with capital letters
- to display in red if the population is less than 20 000 inhabitants
Conditional formating is often used, for land surveying, date inferior to 2 months...
Display solutions
- The first one about capital letters, replace
by
1[% "name" %]1[% upper("name") %] - The second one about the population in red, replace
1[% "population" %]1<font color="[% if( "population" > 20000, 'black', 'red') %]">[% "population" %]</font>
Editing capabilities on a layer#
We want now to enable editing capabilities on a layer in the Lizmap interface, to let some users add some observations.
- In QGIS, try to add a point and check how the default form is displayed on the layer observations. You need to toggle editing mode first with the yellow pen.
- Improve the form in QGIS :
- Layer Properties ➡ Attributes Form -> Drag&Drop layout form
- Remove the field
id - Make two groups :
RequiredandOptional
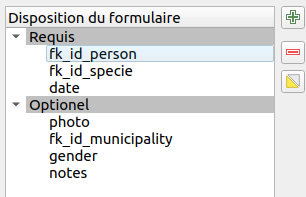
- Field configuration :
fk_id_person:- Alias
Watcher - Relation reference with
name
- Alias
fk_id_specie:- Alias
Species - Value relation layer
species, key columnidand valuees_nom_commun
- Alias
date:- Alias
Date - Date/Time by default
- Alias
photo:- Alias
Photo - Attachment
- Alias
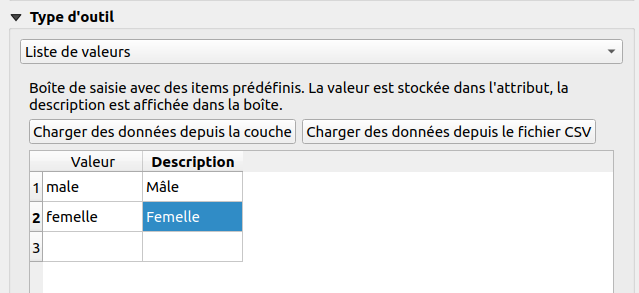
gender:- Alias
Gender - Value map and add some values in the table
Male,Female
- Alias
fk_id_municipality:- Alias
Municipality - Value relation
- Layer
municipalities - Key
id - Value
name - Filter expression
intersects( @geometry, @current_geometry )
- Alias
- As soon as you have your form ready in QGIS (more or less 🙂), add the layer in the editing panel in Lizmap
Tip
We can use QGIS Expressions in the form (visibility, conditions, default value, etc.). Read the documentation. It's ongoing work as there are different contexts for evaluating expressions.
PDF Print#
Extent chosen by the user#
- In the given QGIS project, there is already a layout
Landscape A4. - Enable print in your Lizmap plugin, map options tab.
- Customize the title from Lizmap web interface in the PDF :
- Click on the title
Example workshop - In the properties, look for Object identifier and set
title
- Click on the title
Success
In this case, the user is choosing the area of interest
From a popup, extent defined by the feature#
- In the QGIS layout manager, duplicate the existing layout and let's transform it to an atlas
- Project menu, Layout manager, Duplicate, name
PDF sheet - Edit this new layout
- Enable atlas on the municipalities layer
- Change the title to display the name of the municipality
- Enable the map to "follow" the current feature
- Project menu, Layout manager, Duplicate, name
- Check in the result in Lizmap
Success
While in this situation, the PDF is linked to a feature.
Dataviz#
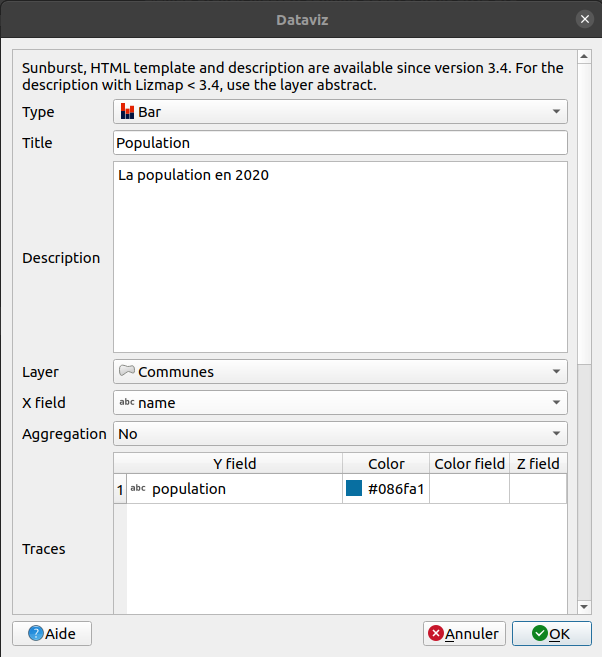
Bar chart#
- Add bar chart in the Lizmap plugin about population in municipalities (and not a histogram).
- Layer : Municipalities
- X Field : Name
- No aggregation
- Trace :
- field population
- color blue
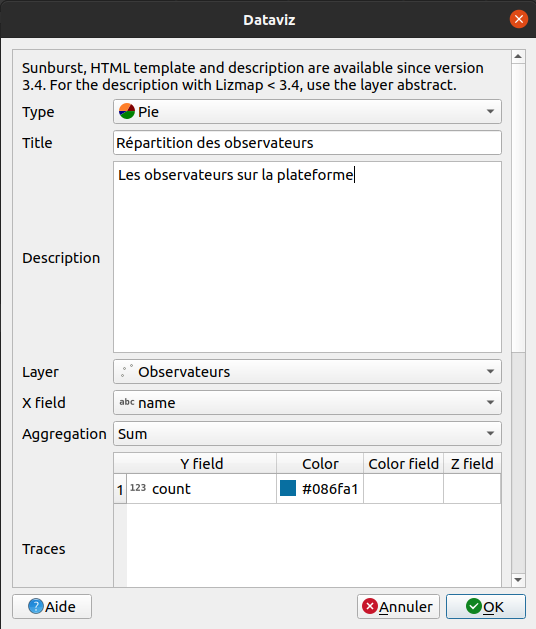
Pie chart#
- On "persons" layer, add a pie chart about each "watcher" :
- Add a virtual field in "persons" called
count, integer :
- Add a virtual field in "persons" called
1 2 3 4 5 | |
- Add pie chart in the Lizmap plugin
- Title
- Description
- Layer : Persons
- X Field : Name
- Aggregation sum
- Trace : count
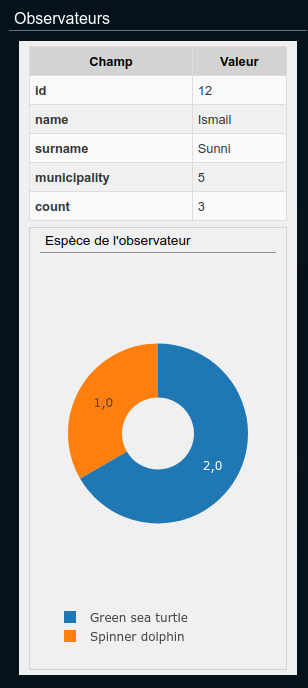
Advanced filtered plot#
For now, it's only charts at the layer level. It's possible to make charts for a given feature, for instance for a given "watcher", to know his own observations. You can watch the animated GIF at the bottom to understand the expected output, in the "Final result".
Tip
Watch the video tutorial about the filtered plot.
- Add a virtual field
label_species(text) in theobservationslayer to have the name :
1 | |
-
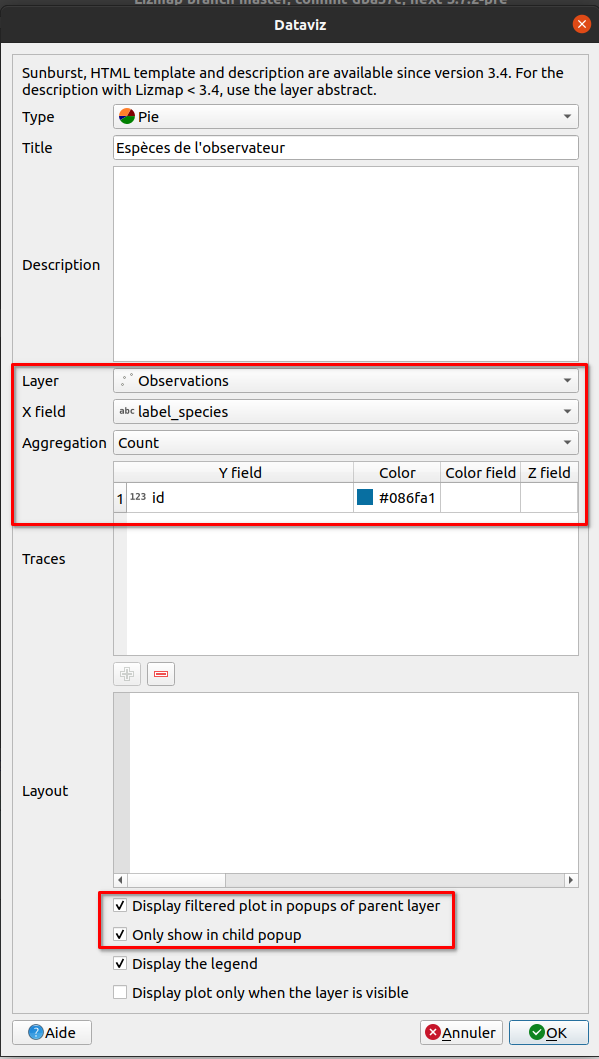
Add a pie chart on the
personslayer :- Pie
- Title : Species
- Layer : Observations
- X Field :
label_species - Aggregation
Count - Traces :
id - Checkbox Display filtered plot in popups of parent layer
- Checkbox Only show in child popup
Final result
Thanks 😎